JMeter – Continuous Performance Testing – JMeter + ANT + Jenkins Integration – Part 2

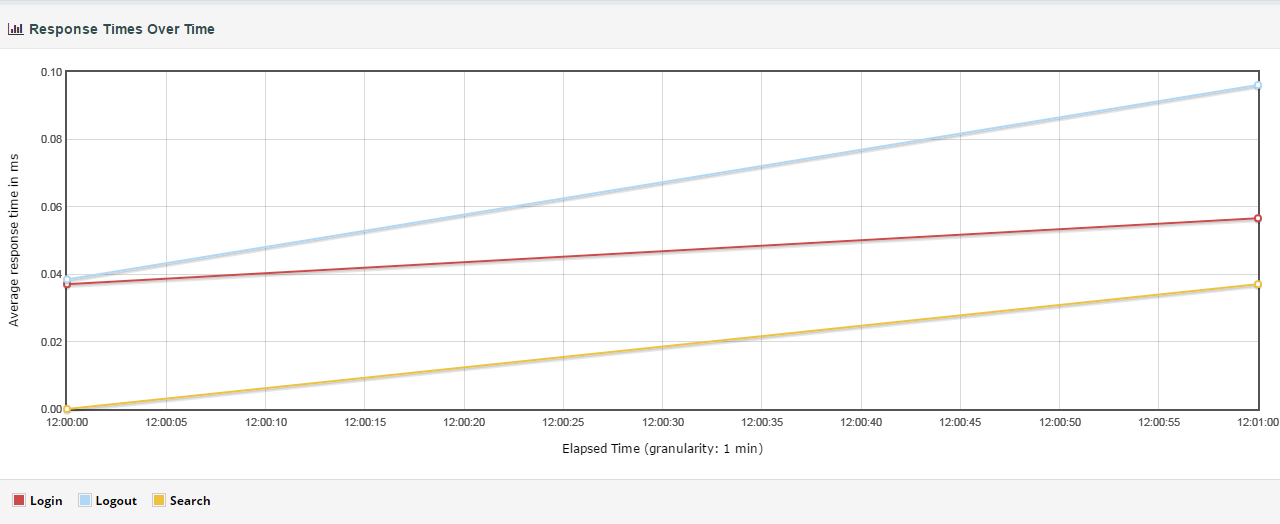
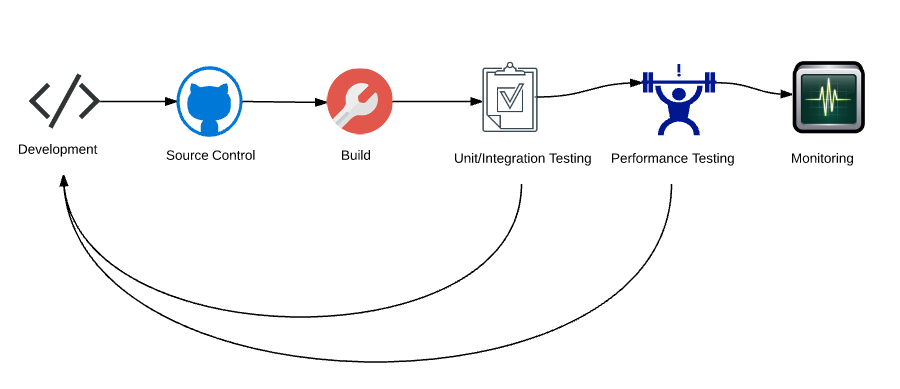
Goal: To create a Continuous Delivery Pipeline which includes Performance Testing process to detect any performance related issues as early as possible. Usually the full scale Performance Test will be done in the Staging/Pre-Production environment which could be identical to your Production environment. Code push to Staging happens after thorough QA functional/regression verification is done. So even if […]

JMeter – Continuous Performance Testing – JMeter + ANT + Jenkins Integration – Part 1

Goal: To create a Continuous Delivery Pipeline which includes Performance Testing process to detect any performance related issues as early as possible.   Usually the full scale Performance Test will be done in the Staging/Pre-Production environment which could be identical to your Production environment. Code push to Staging happens after thorough QA functional/regression verification is done. So even

JMeter – Continuous Performance Testing – JMeter + ANT + Jenkins Integration – Part 1Read More »

JMeter – Response Data Extractors – Comparison

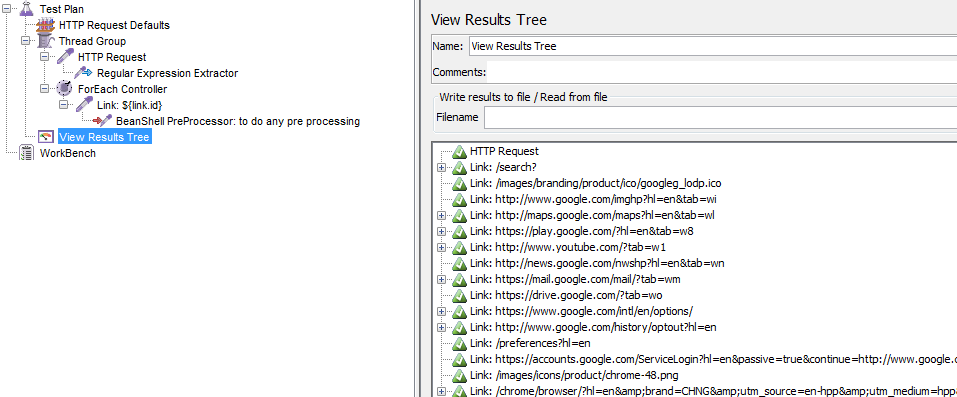
If you are using JMeter, You would have also used any of the below Post Processors to extract information from the Sampler response and use it for the subsequent request or response validation. CSS/JQuery Extractor JSON Path Extractor Regular Expression Extractor XPath Extractor But do they all perform same? How do they affect the JMeter

JMeter – Response Data Extractors – ComparisonRead More »

JMeter – Real Time Results – InfluxDB & Grafana – Part 1 – Basic Setup

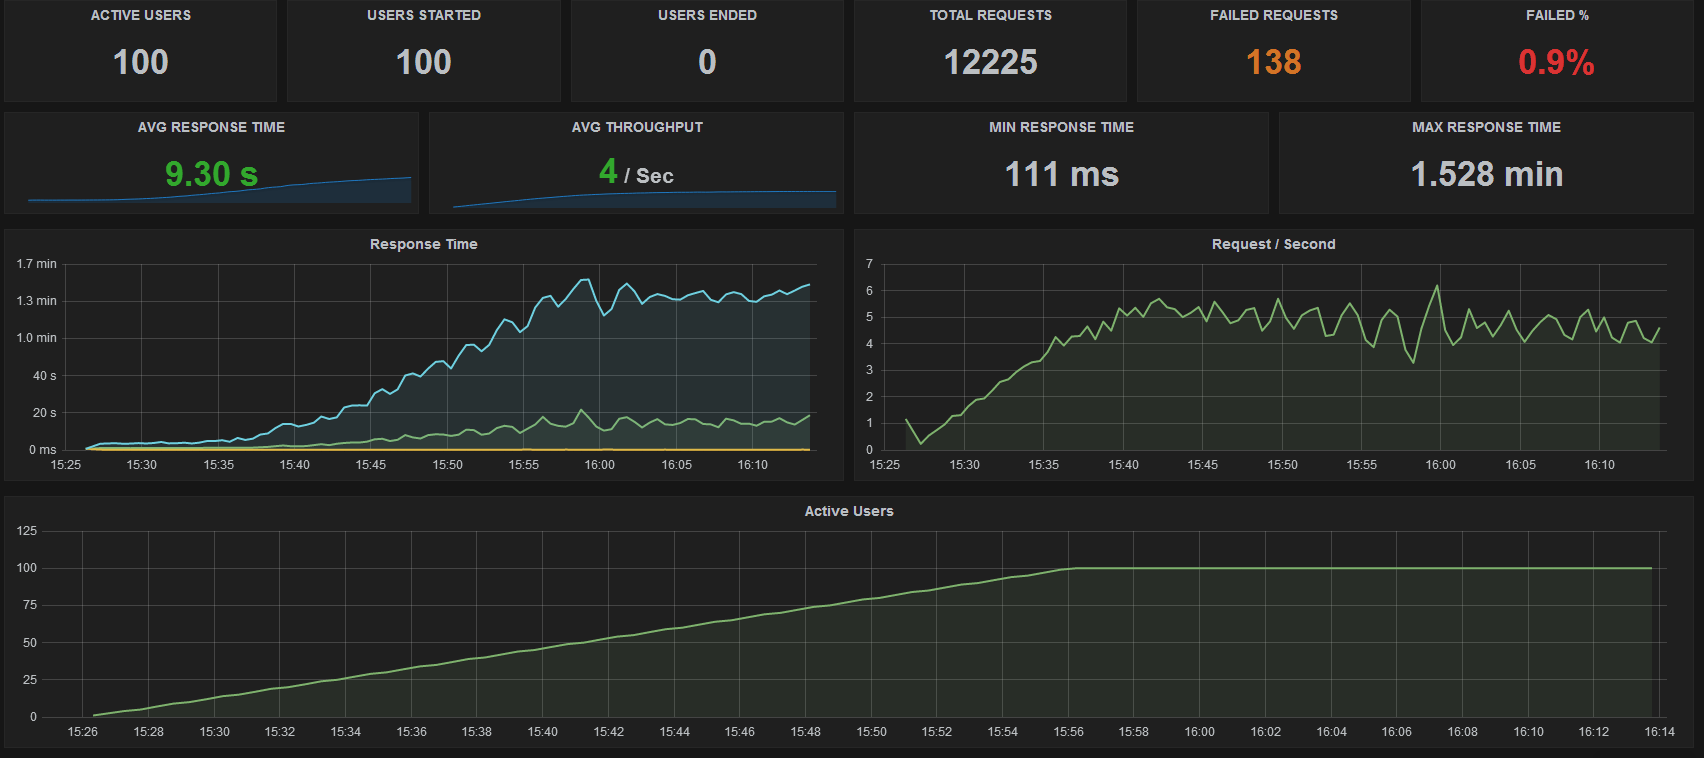
Overview: In this article, I will explain how we could get real time performance test results using JMeter + InfluxDB + Grafana. Please do note that this topic is too huge to cover everything in one article.  So, I have tried to provide links to other articles of TestAutomationGuru which could be related to this

JMeter – Real Time Results – InfluxDB & Grafana – Part 1 – Basic SetupRead More »

JMeter – Server Performance Metrics Collector

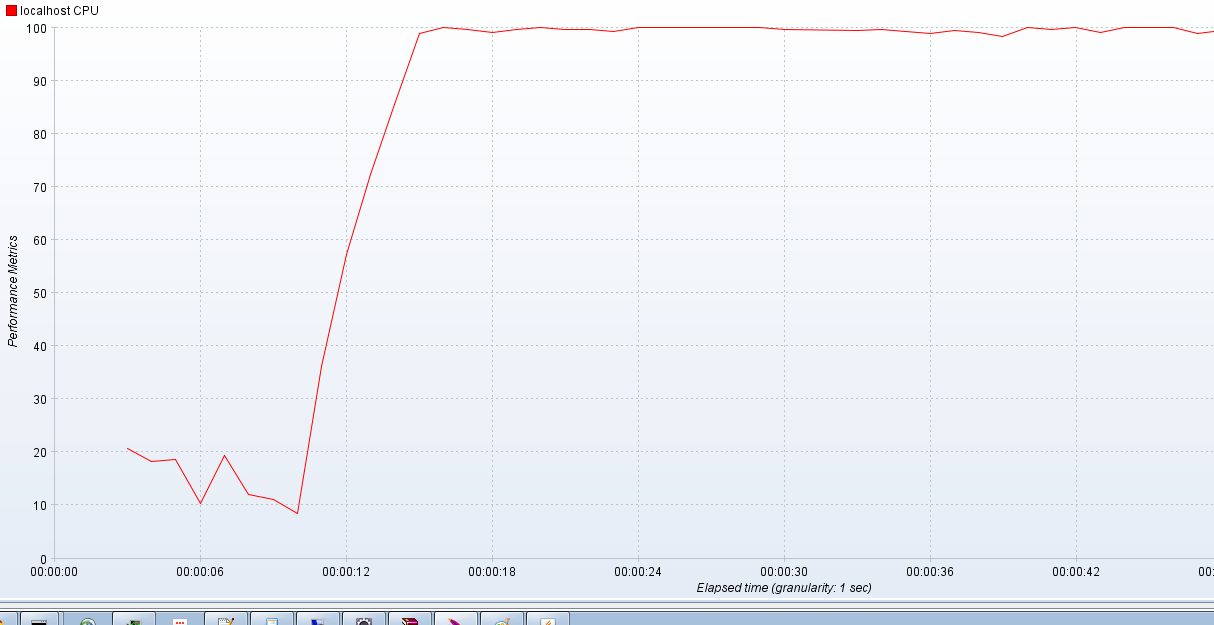
JMeter has many listeners which provide useful information like Number of the requests processed Average response time Throughput 90% line Error %   etc But….What about the server performance metrics? like CPU / Memory utilization. JMeter is not only generating the load on the server but also comes with an agent which can run on the

JMeter – Server Performance Metrics CollectorRead More »

JMeter – Record iOS application HTTP requests

In this article, Lets see how to record iOS application HTTP/HTTPS requests using JMeter. Desktop/Laptop Setup: Make a note of your Desktop/Laptop IP address. Ensure that you have JMeter 2.11 or above & Java 7 or above. JMeter Setup: Start JMeter . (Go to JMETER_HOME/bin, Start jmeter.bat or jmeter.sh) Under JMeter Test Plan – Workbench, add ‘HTTP(S)

JMeter – Record iOS application HTTP requestsRead More »

JMeter – How To Run Multiple Thread Groups in Multiple Test Environments

Overview:  As part of performance testing,  I had to come up with performance test scripts for various use cases / business workflows for our application. When I design my performance test scripts, I will ensure that I have reusable test scripts as mentioned in this article. JMeter – How To Create Reusable & Modular Test

JMeter – How To Run Multiple Thread Groups in Multiple Test EnvironmentsRead More »