Overview:
Testautomationguru already has released few detailed articles on creating real time results during Performance Testing. If you have not read them before, I would suggest you to check them out first.
- JMeter Real Time Results – Basic Setup
- JMeter Real Time Results – Advanced Setup for multiple projects
- JMeter – Server Performance Monitoring
- JMeter – JMX Monitoring
Challenge:
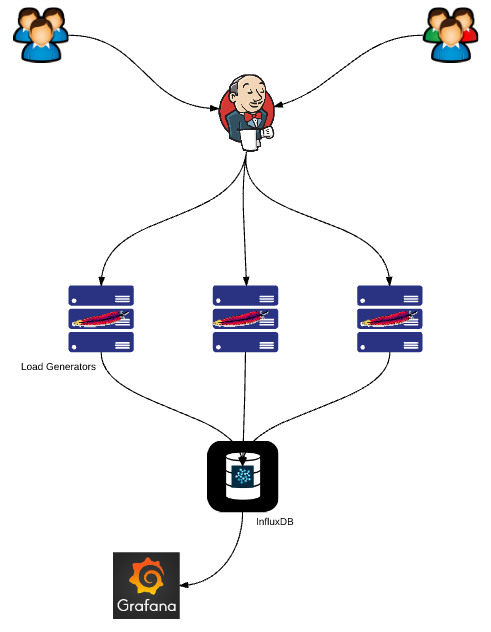
The challenge here is, We have multiple systems in our architecture. Jenkins, JMeter-Load-Generators, InfluxDB, Grafana etc. When we run our performance test through Jenkins, we have our build history as shown here. It is little bit difficult for us to access the corresponding Grafana dashboard for the old Jenkins runs from the build history – We need to adjust the time in the Grafana based on the Jenkins build time to get the results.
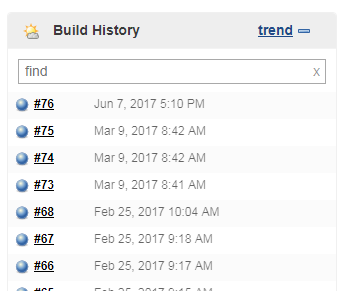
In this short article, We are going to see how to provide a dynamic link to Grafana dashboard in Jenkins as part of the build. So that It is easy to access the performance test results from the build history.
Getting Grafana Dashboard URL:
- First, Go to Grafana. click on share Dashboard button.
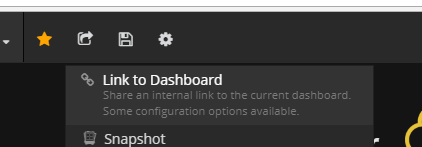
- Click on Link to Dashboard to get the link – so that we could dynamically build URL modifying time stamp in it.
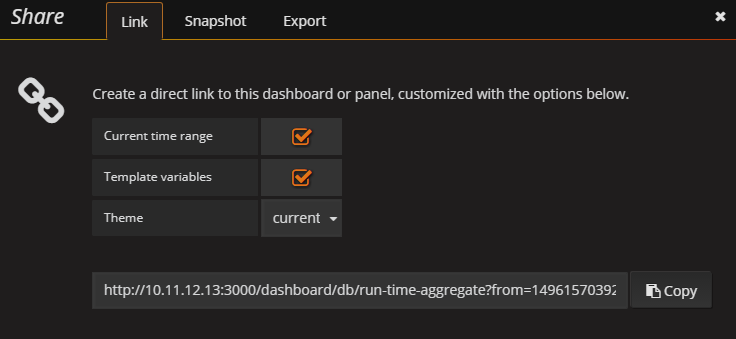
- I have below URL for my dashboard. Here we just need to replace from and to time. Everything else remains unchanged. If you have template variables, Your URL might have some additional attributes along with time. That is fine. You do not need to change them. We will just replace time in it.
http://10.11.12.13:3000/dashboard/db/run-time-aggregate?from=1496157039283&to=1500936673672
Jenkins – Grafana Integration:
- Install Groovy Post Build plugin.
- For the Performance Test Jenkins job, we would add ‘Groovy Post Build’ action.

- In this section, We would add below script which builds the URLs for the Grafana dashboards dynamically.
import hudson.model.*

//get current build
def build = Thread.currentThread().executable

// grafana url for aggregate dashboard - replace time stamp with %s
def perfResult = "http://10.11.12.13:3000/dashboard/db/run-time-aggregate?from=%s&to=%s"
def jmxMonitor = "http://10.11.12.13:3000/dashboard/db/jmx-monitor?from=%s&to=%s"

// get build start and end time
def start = build.getStartTimeInMillis();
def end = start + build.getExecutor().getElapsedTime();

// replace time
perfResult = String.format(perfResult, start, end);
jmxMonitor = String.format(jmxMonitor, start, end);

//build the string to be added as description.
def link = "<a href='%s'>%s</a><br/>";
def sb = new StringBuilder();
sb.append(String.format(link, perfResult, "Grafana Performance Result"))
  .append(String.format(link, jmxMonitor, "Grafana JMX Result"));

// set build description
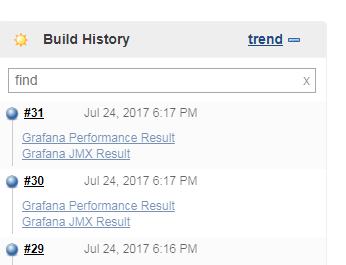
build.setDescription(sb.toString());- Thats it!! Now, whenever the Jenkins runs the performance test, once it is run, It adds the URLs for the Grafana Dashboards in the build description as shown below.
Summary:
Each Jenkins build has the corresponding URLs for Grafana Performance Test Results and JMX Results. We could even add the Kibana URL for the performance result log if you are collecting HTTP response as described in this article.
Happy Testing & Subscribe 🙂

Hi ,
Thanks for the Info
instead of this “build.getExecutor().getIdleStartMilliseconds()” if we use
build.getStartTimeInMillis(); we are getting accurate results
Thanks. updated.
Great Article 🙂 Really helped me in implementing the similar architecture in my project. I was wondering if there is any way to fail the build if CPU/Memory utilization goes beyond certain percentage -that would be an awesome addition to this load testing setup.
There are few articles on this site on collecting server side metrics.
http://www.testautomationguru.com/jmeter-server-performance-monitoring-with-collectd-influxdb-grafana/
http://www.testautomationguru.com/jmx-monitoring-using-collectd-influxdb-grafana/
Failing the build based on the cpu/memory utilization, seems to be simple. I will add an article on that when i fine time.
The code provide is not producing the links. It is only showing the html shown below. is there a plugin I’m missing other than the groovy post build?
Grafana Performance Result
You only need groovy post build plugin. please check for any errors in the log.
Figured out what was wrong. Need to add OWASP Markup Formatter plugin, Then go to “Configure Global Security” -> Select Markup Formatter “Safe HTML”. Works like a charm. Thanks.
There is no need for the OWASP Markup Formatter plugin. But indeed the Marup Formatter configuration might have to be changed from “Plain Text” to “Safe HTML”.
Iam trying to integrate the results of a soap ui test run in jenkins with the grafana dashboards, would that be possible if i follow the same steps?
Yes, it should work
hi,
Thanks for your information,
I have one question.
I have a test script which has test duration is 5m. But when I using the code below. Time Elapsed more than the duration time. (maybe ~ 10m ).
How to get exactly the duration time?
Could you please help me.
This is jenkins job duration. It might include the time for cloning the repo as well. Your test script is just part of the job.
Hi Vins,
First of all thank you for such helpful articles 🙂
I want to know if it is possible to get Grafana icon instead of url with every build that will take to the dashboard?
I am using it for a microservices project where the grafana icon should take to the dashboard for that particular microservice (microservice is added in variables in grafana).
Thanks so much vIns, this worked perfectly.
Thanks to zamorav also as their comment helped with the link formatting issue.