I already have been using InfluxDB + Grafana for real time results of my JMeter test. You can find more details on the basic setup here. In this article, Lets see how we can add some custom fields into the InfluxDB measurements for faster search which we might need in future.
Problem Statement:
In my organization we have a set of load generators for our performance testing. We use these machines for testing multiple projects / applications. Sometimes, I create multiple suites for component level testing of the application. You can check here to understand how I do this.
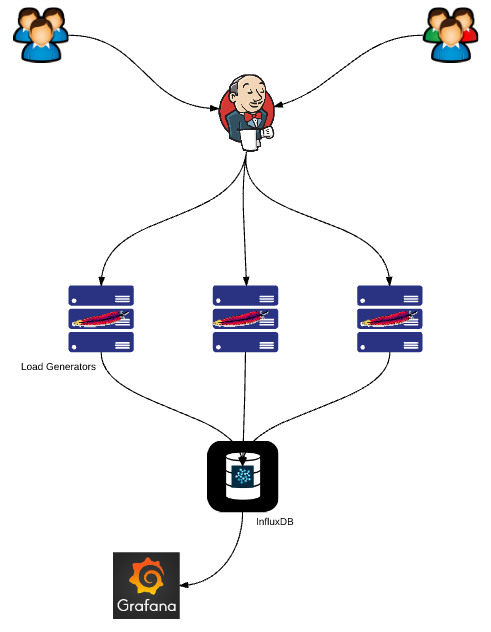
Our Backend Listener sends all the metrics into these measurements – end of the day – we are not sure of the application/project these metrics belong to.
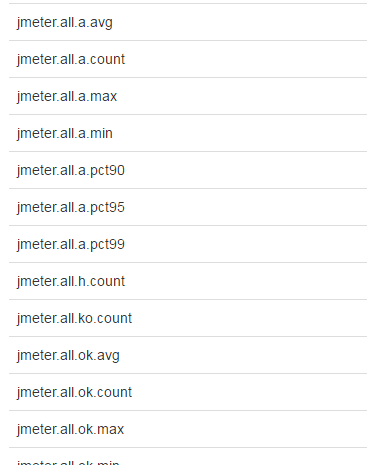
It would be great if we could filter the metrics based on the application / project / suite / even Jenkins build #.
Solution:
Fortunately we do not have to come up with our own implementation to achieve this. The solution is very simple using existing JMeter’s Backend Listener itself.
- Just for this article, I create a simple JMeter test as shown here.
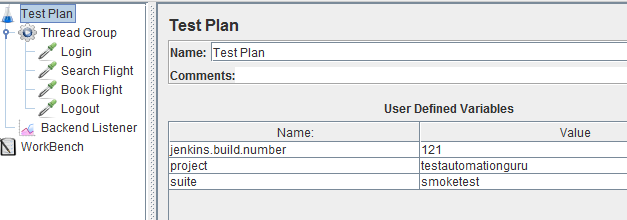
- Lets add few user defined variables as shown here. I have hard-coded values here. You can parameterize it – pass the values from Jenkins.
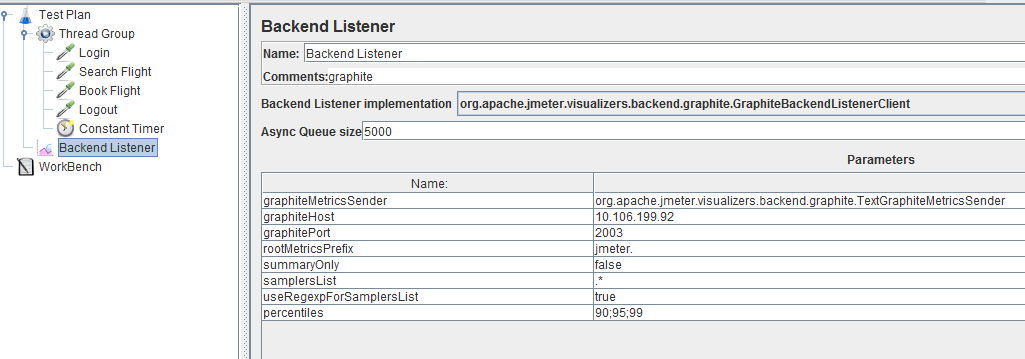
- Now I need to send these values to InfluxDB. Easiest option is to update the Backend Listener’s rootMetricsPrefix.
jmeter.${project}.${suite}.${jenkins.build.number}.
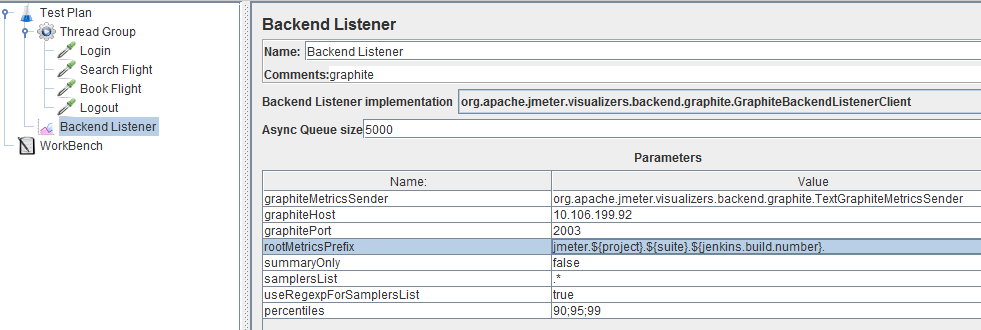
- Run the JMeter test. Wait for few seconds.
- Check the measurements created by JMeter.
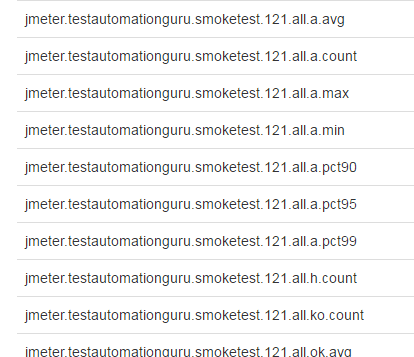
- These measurements names help us to identify the metrics project / application / suite / Jenkins build number wise.
But, It was NOT really what I wanted!!!

I do not want tons of measurements in InfluxDB which becomes very difficult to query / maintain.
Lets see how we could do better.
JMeter’s Graphite Inputs:
JMeter sends 2 types of metrics to InfluxDB in the below formats.
- Response Time Metrics:
jmeter.testautomationguru.smoketest.121.Login.a.avg 135
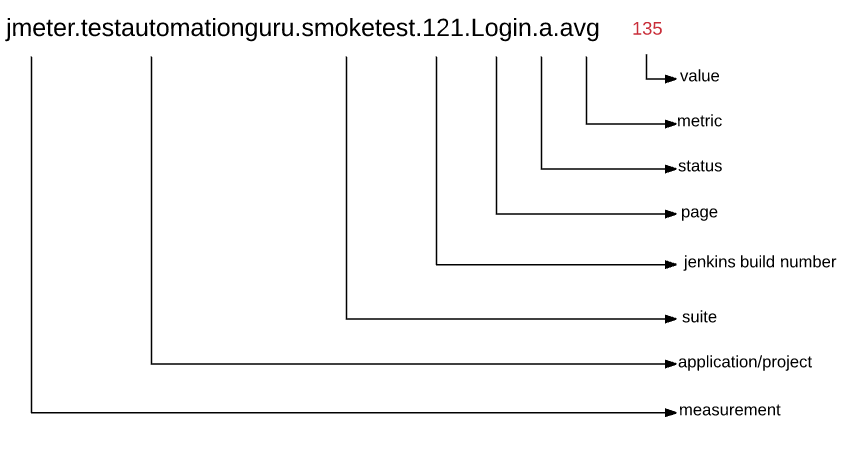
status could be ok for pass, ko for fail, a for all
metric could be min, max, avg, pct90, pct 95 etc
page could be sampler name for sampler level details or all for aggregate info.
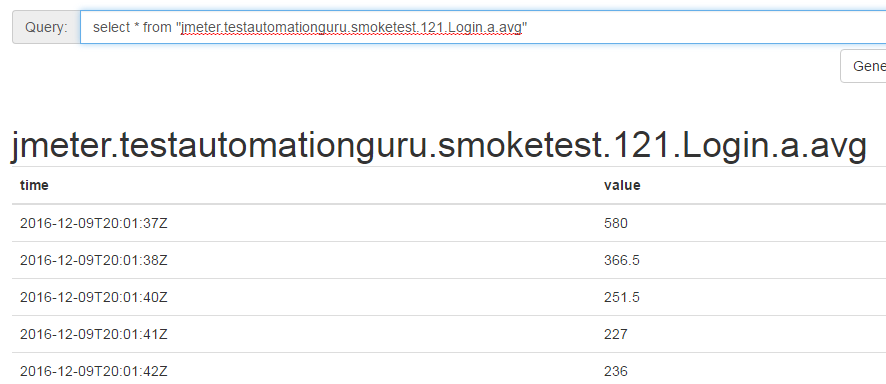
When InfluxDB receives data like this, If It is unable to locate template, It will create the measurement with the name if it is not present already & logs the value against the current time stamp in the measurement.
- Thread / Users Metrics:
jmeter.testautomationguru.smoketest.121.test.meanAT 10
This is same like above. page & status are missing here & replaced by ‘test‘.
Templates for Graphite Inputs:
By using a template for the graphite inputs, we can avoid creating multiple measurements.
More information on Graphite Input template is here.
That is, the template for the Response time graphite input “jmeter.testautomationguru.smoketest.121.Login.a.avg” would be “measurement.project.suite.build.page.status.metric”
We need to log thread/users metrics in different measurement as it can not be part of sampler level metrics. As JMeter sends 2 metrics in slightly different formats, Lets catch them separately.
By using regex format, if the input is in certain format, We can instruct InfluxDB to use specific template.
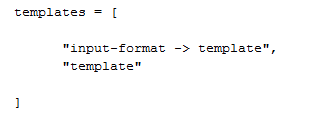
For this input – “jmeter.testautomationguru.smoketest.121.test.meanAT“, project, suite, build number can be anything. But It will be followed by ‘test‘ for sure.
So, all the user metrics can be captured by this input format – “jmeter...*.test”
Update the templates accordingly in InfluxDB config file and restart InfluxDB to fetch update the configurations.
Run the JMeter test now & see. [Please note that InfluxDB will use the template only for new inputs. Existing measurements can not be altered]
We could see only 2 measurements now. 1 for response time & other one for user metrics.
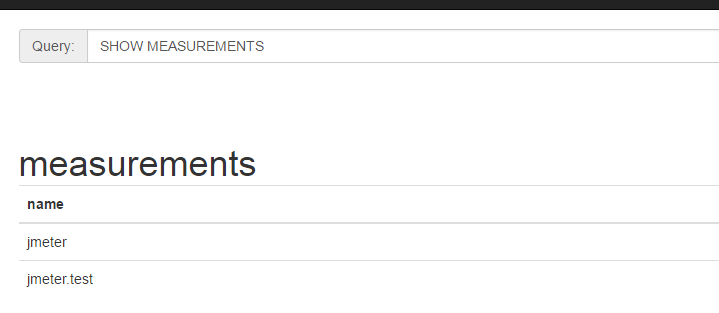
If I query the measurement, I get my project/application,suite, build info, page, status etc as different columns.
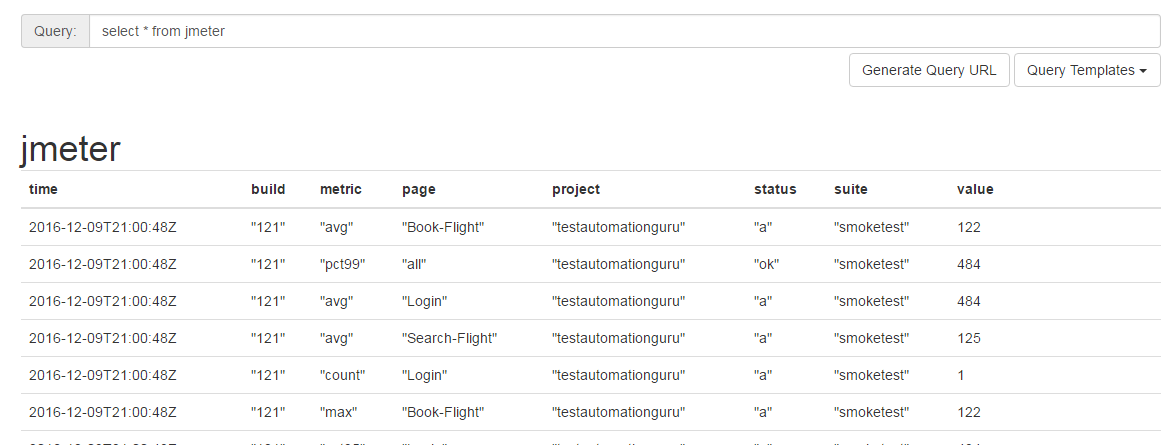
“jmeter.test” is for thread/user metrics which has similar information.

This is much better!!

Grafana Templates:
As we log project, suite, Jenkins build #, metric etc as measurement tags/columns, We can use Grafana templates to filter / repeat entire rows.
- Go to Grafana -> Dashboard -> Manage Dashboard -> Templating to create a new variable.
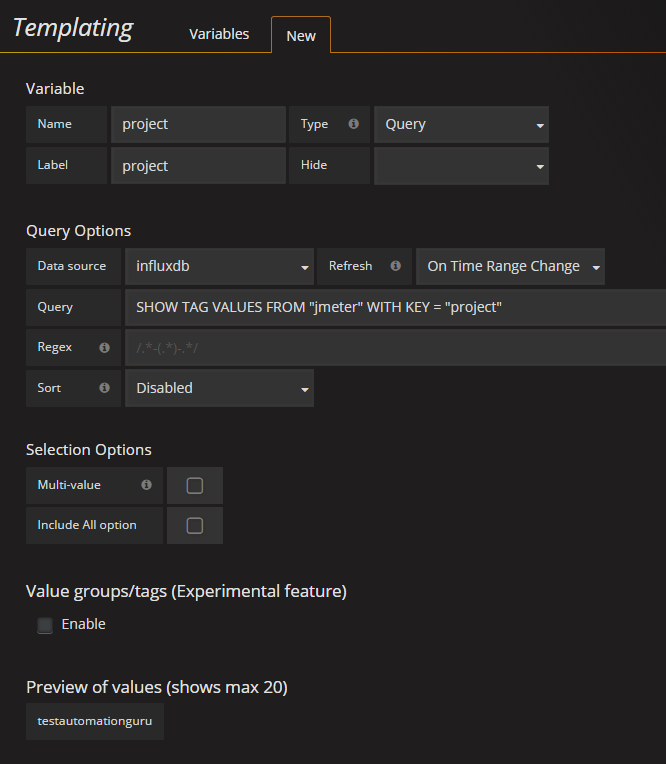
Check this video on creating template variables & using in the query for filtering.
Repeating Panel For Page:
We can make the entire panel repeat for each variable/page. Check this video.
Summary:
As we have seen we should be able to add some custom data in InfluxDB for faster search using Graphite Input templates & Grafana template variables.
This article only covers the JMeter performance test results. You also might be very interested in collecting application server performance metrics + JVM metrics. Check below articles of TestautomationGuru.
Happy Testing & Subscribe 🙂

Hi ,
Thanks for the article
And is the any way to filter the transactions based on the project
Suppose i am using Project and i have transaction 1,2,3 and i have project b and the transaction are 5,6,7
If i select the project A and i have only the page 1,2,3 but we are getting all the page which is available in the database
I tried the tag query but its not working for me and let me i f you have any query for this
Regards,
Venkat
Hi ,
For the above one i got the solution just we need to pass the below query
SHOW TAG VALUES FROM “jmeter” WITH KEY = “page” where project=~ /$project/ in the page template, it will sort the page transactions based on the project
I want the throughput and Error% to be captured in the db(here it is influxdb, ideally i am looking for SQL Server if possible otherwise this will also work). Any idea what changes i will have to do to get the Throughput and Error%?
Please suggest me on this.
Throughput and Error % are aggregate information. Check this post for saving the results to a DB – http://www.testautomationguru.com/jmeter-save-results-to-a-database/
You can come up with your own logic to write to any DB you want. Once you have the data, you need to calculate yourself for the throughput / error %.
For ex: if you have 120 login requests in 60 seconds, then login throughput is 2 / second.
Hi vlns,
Great job on all you posts. I’m kinda new to Grafana, however I have set it up and it seems to be returning the page response times accurately. Looking over your graphs I was wondering how you are getting error rates and failed percentages. I know what it should look like however it don’t know how to put it into Grafana.
Hey Guru, the test template link does not work. Is there anywhere else we can see additional templates? Right now I only have this one:– “jmeter...*.test measurement.project.suite.build.measurement.thread”,”measurement.project.suite.build.page.status.metric”– which does not give me response codes, response messages, or error messages. Can you help? ..
Thanks for letting me know. There are changes at InfluxDB side. I have updated the link now. You can refer to that.
Hi Vln,
Once we have “jmeter” and “jmeter.test” measurements (tables) in the db , how we can get the counts of all requests , all successful requests etc ?
Thanks