Overview:
In this post, Lets see how we can use Beanshell Listener / JSR223 Listener in JMeter to send the result, the way we want, to a database. The below approach will work like Backend Listener of JMeter to post the sampler results into InfluxDB.
Sample Result API:
To write the results the way we want, We will be using the SampleResult API in the listener.
Lets assume we are interested in the sample label, no of samples executed, response time, status and time-stamp the sample occurred.
- sampleResult.getSampleLabel() – gives the sample name which just occurred.
- sampleResult.getSampleCount() – no of samples
- sampleResult.getTime() – duration of the sample
- sampleResult.getResponseCode() – response code
- sampleResult.getTimeStamp() – timestamp
- sampleResult.isSuccessful() – true if it is success; false otherwise.
InfluxDB:
I would be using InfluxDB as backend to store the data using its HTTP API.
Check here for more information.
At this time of this post, v0.12 is latest. Please check InfluxDB site for the latest versions installation steps as the above URLs might not work later.
Ensure that your InfluxDB is up and running. You should be able to access the admin interface on the port 8083. http://[ipaddress]:8083
Create a database ‘demo’ with this query: CREATE DATABASE “demo”.

JMeter Test Plan:
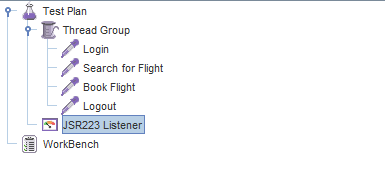
We would be creating a very simple test plan as shown below. I am just using a ‘Dummy Sampler’ – changed the label names.

JSR223 Listener:
I use JSR223 Listener with Groovy. If you do not have groovy jar, download it from here and place it in %JMETER_HOME%/lib folder. You can also use Beanshell listener for this purpose. JMeter comes with all the required dependencies for beanshell.
In this listener we would be accessing sampleResult API directly to get the sample metrics which just occurred.
InfluxDB HTTP API interface would expect the data in the below format. So build the result string accordingly.
samples,label=lbl,status=status count=count,duration=duration,responsecode=rc timestamp
Add below code in the JSR223 Listener.
result = new StringBuilder();

status = "Failure";
if (sampleResult.isSuccessful())
    status = "Success";

//Expected format to post the result
//samples,label=lbl,status=status count=count,duration=duration,responsecode=rc timestamp

result.append("samples,") //samples is the table name in InfluxDB which we will create at run time.
    .append("label=")
    .append(escapeValue(sampleResult.getSampleLabel()))
    .append(",status=")
    .append(status)
    .append(" ")
    .append("count=")
    .append(sampleResult.getSampleCount())
    .append(",duration=")
    .append(sampleResult.getTime())
    .append(",responsecode=")
    .append(sampleResult.getResponseCode())
    .append(" ")
    .append(sampleResult.getTimeStamp())
    .append("000000");
The above code will build the string to post the data. However we need to escape “,”, ” “, “=” in the string as these have some meaning in InfluxDB query.
//Escape the string values before posting the data

String escapeValue(String val) {

    val = val.replaceAll(",", "\\\\,")
        .replaceAll(" ", "\\\\ ")
        .replaceAll("=", "\\\\=")
        .trim();

    return val;

}
Lets add the function which will post the data to influxDB.
// Post the result to influxDB

import org.apache.http.HttpResponse;
import org.apache.http.client.methods.HttpPost;
import org.apache.http.entity.StringEntity;
import org.apache.http.impl.client.DefaultHttpClient;
import org.apache.http.params.BasicHttpParams;
import org.apache.http.util.EntityUtils;

void PostMeasurement(String metric) {

    def httpclient = new DefaultHttpClient(new BasicHttpParams());
    def httpPost = new HttpPost();

    //URL format : http://[ipaddress]:[port]/write?db=[database]

    httpPost.setURI(new URI("http://[ipaddress]:8086/write?db=demo"));
    log.info("Result : " + metric);
    httpPost.setEntity(new StringEntity(metric));
    HttpResponse response = httpclient.execute(httpPost);
    EntityUtils.consumeQuietly(response.getEntity());

}
Thats it. Now add this line to call the function which posts the data.
PostMeasurement(result.toString());
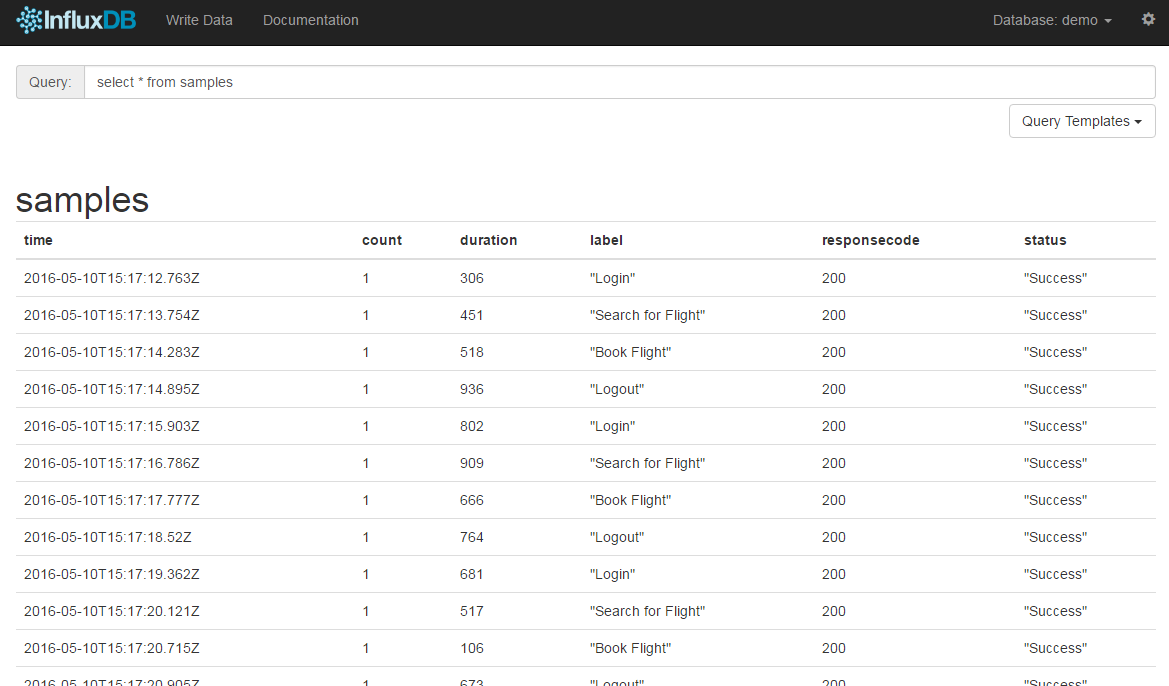
Run the test for couple of times. Now query the InfluxDB using its Admin interface. “select * from samples” on the demo Database will show the results as shown below.

If you are still facing issues in sending the data to InfluxDB - Check this post to troubleshoot.
Summary:
Without using any plugins/backend listener/extending jmeter functionilities using its interface, We saw how to write the results in DB. This approach might be slow if you do not have any timers in the test plan. You can modify the approach slightly to post the data asynchronously. We can also modify the listener to post the data once in certain interval (say 30 seconds) instead of posting for every sample which will help with performance.
Happy testing 🙂


I appreciate the concept of this approach; I’ve implemented it in one script and I’ve a couple questions.
First, you have responsecode as a field, not a tag. I’m curious what your reasoning is? I find it much more useful for graphing and visualization to have it be a tab in influxdb. I’m using Grafana for graphing and having it be a tag makes it easier to work with.
Second, (and I’m using Jmeter 3.0) and I’ve noticed that as written it seems to be opening 1 connection to Influxdb per sample. My script is a series of quick api calls (they take 10 – 80 ms for most) and I’ve currently got over 500 connections to my Influxdb (I’m running a single user execution of my script). So, this solution (for me, at least) will need some tweaks before it can scale. You mention a way both make the call asynchronous and to make the call on an interval – can you point me in the right direction for how to do that? Or perhaps a way to re-use connections, or not keep them alive? I’ve noticed that I’m limited on connections, even if I use distributed jmeter since all the jmeter nodes are hammering my influxdb instance. I haven’t looked at how influxdb is handling incoming connections, there may be a way there to have the connections be terminated more quickly. Thanks again for all your effort!
Mousekatool, you might get some ideas/responses as well if you ask about this in the (official) jmeter mailing list as well as other jmeter forums, etc.
I would think “modify the listener to post the data once in certain interval (say 30 seconds) instead of posting for every sample” would be something like using a jmeter variable or property to define the interval, and for the listener to sleep (or similar action) until the interval is reached before sending out the result to DB. But that only delays sending the data, you still have X amount of samples to send delayed by Y interval period.
So next to reduce amount of data to send to DB after the interval period, one may need to batch or aggregate up the data to send. For example, while the interval period has not been met (where we’re supposed to sleep, but before sleeping), we take the current sample result, process it against the previous batched/aggregated result if it exists, and when interval met, we emit the batched/aggregated result to DB. The batching/aggregating could simply be taking an average or weighted average (or a percentile) of the raw results over the defined interval. This results in more computation work on jmeter side but less data transfer and connections to the DB.
Hi,
What should I need to do if I want to send the throughput value into InfluxDb ? I already scripted something like this to get the value of throughtput:
def bytes = sampleResult.getBytest();
def elapsed = sampleResult.getTime();
def bytespersec = bytes / (elapsed / 1000);
def kbpersec = bytespersec / 1024;
def throughput = kbperserc / ( bytes / 1024 ) ;
log.info(“Throughput : ” + throughput);
but this value seems to be incorrect. Many thanks for your help.
In order to calculate the throughput for certain interval (say per minute), you also need other sampleResult for all samples occurred in that window. sampleResult API will have the info only for the sample which just occurred.
Throughput is a derived metric – ie just store all the results in the DB. Later query DB for the no of requests processed / minute to find the throughput.
If I’m not mistaken, this approach only works in jmeter GUI mode? So if one wants to do custom data processing with listener in CLI mode, they have to do what you did with modifying the jmeter Summarizer in apache/jmeter core?
http://www.testautomationguru.com/jmeter-real-time-results-influxdb-grafana/
Benashell Listener should approach work in both CLI/GUI modes.
isnt it possible to add my own column to it.by using .append(“Throughput=”) ????
PAM, i want you to understand that you need to post the data in the DB. Then calculate the throughput yourself from the data. I see that you seem to have issues in implementing – http://www.testautomationguru.com/jmeter-real-time-results-influxdb-grafana/ – Please mail me (vino.infy@gmail.com) with your questions. I will try to see if i could help.
What if I want to same the transaction timings into MySQL, MS SQL Server, Oracle, SQL+, or an ODBC compliant database?
You can implement the same using Beanshell Sampler + java lib. JMeter also allows us to extend the functionalities through custom plugins. This is much better approach. Check here – https://jmeter.apache.org/extending/jmeter_tutorial.pdf
i want to send the data from jmeter to perticular db of influxdb.
Results of test1.jmx should be store in test1.db and results of test2.jmx to test2.db. Is there any ways to do that
If 2 different tests, then you would be using 2 different listeners – one for each! Can it not be modified ? I think, I did not get your question correctly.