Overview:
In this article, I would like to show you the difference between the Kubernetes Liveness probe vs Readiness probe which we use in the Pod deployments yaml to monitor the health of the pods in the Kubernetes cluster.
Need For Probes:
Pod is a collection of 1 or more docker containers. It is an atomic unit of scaling in Kubernetes. Pod has a life-cycle with multiple phases. For example, When we deploy a pod in the Kubernetes cluster, Kubernetes has to start from scheduling the pod in one of the nodes in the cluster, pulling the docker image, starting a container and ensuring that containers are ready to serve the traffic etc!
As Pod is the collection of docker containers, in order to accept any incoming request, all the containers must be ready to serve the requests! So it will take some time – usually within a minute & but it mostly depends on the application. So, as soon as we send a deployment request, our application is not ready to serve! Also, we know that software will eventually fail! Anything could happen.For example, a memory leak could lead to OOM error in few hours/days. In that case, Kubernetes has to kill the pod when the pods are not working as expected and reschedule another pod to handle the load on the cluster.
Kubernetes Livenesss Probe and Readiness probe are the tools to monitor the pods & its health and take appropriate actions in case of failure.
These probes are optional for a Pod deployment and should be configured under a container section in the deployment file if required.
To demonstrate these probes behavior, I am going to create a very simple Spring boot application with a single controller.
Sample Application:
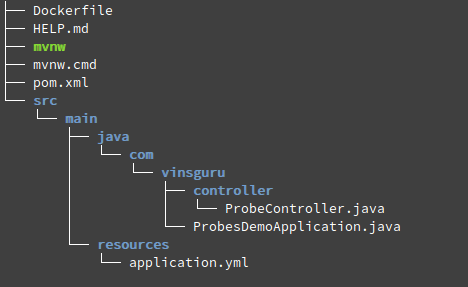
I am creating a very simple Spring boot application to show how things work! This is my project structure.

- ProbesDemoApplication.java
import org.springframework.boot.SpringApplication;
import org.springframework.boot.autoconfigure.SpringBootApplication;

@SpringBootApplication
public class ProbesDemoApplication {

    public static void main(String[] args) {
        SpringApplication.run(ProbesDemoApplication.class, args);
    }

}- ProbeController.java
- It has 2 end points. /health simply sleeps for the given time and responds with a message how long it was sleeping
- /processing-time/{time} – it sets new time for sleeping for any future /health requests
- The idea for the above requests to simulate some request processing time or to simulate server hanging behavior
- request.processing.time is injected as 0 by default.
import org.springframework.beans.factory.annotation.Value;
import org.springframework.http.ResponseEntity;
import org.springframework.web.bind.annotation.GetMapping;
import org.springframework.web.bind.annotation.PathVariable;
import org.springframework.web.bind.annotation.RestController;

@RestController
public class ProbeController {

    private static final String MESSAGE = "Slept for %d ms";

    @Value("${request.processing.time}")
    private long requestProcessingTime;

    @GetMapping("/processing-time/{time}")
    public void setRequestProcessingTime(@PathVariable long time){
        this.requestProcessingTime = time;
    }

    @GetMapping("/health")
    public ResponseEntity<String> health() throws InterruptedException {
        //sleep to simulate processing time
        Thread.sleep(requestProcessingTime);
        return ResponseEntity.ok(String.format(MESSAGE, requestProcessingTime));
    }

}- Dockerfile
- It accepts an env variable called START_DELAY to simulate slow server start time.
# Use JRE8 slim
FROM openjdk:8u191-jre-alpine3.8

# Add the app jar
ADD target/*.jar app.jar

ENTRYPOINT sleep ${START_DELAY:-0} && java -jar app.jar- Dockerized the app as vinsdocker/probe-demo
Pod Deployment:
Lets deploy the above app. I am creating 2 replicas. I pass the start delay as 60 seconds. Request processing time is 0 seconds.
apiVersion: apps/v1
kind: Deployment
metadata:
  labels:
    run: probe-demo
  name: probe-demo
spec:
  replicas: 2
  selector:
    matchLabels:
      run: probe-demo
  template:
    metadata:
      labels:
        run: probe-demo
    spec:
      containers:
      - image: vinsdocker/probe-demo
        name: probe-demo
        env:
        - name: START_DELAY
          value: "60"
        ports:
- containerPort: 8080- I save this file as pod-deployment.yaml. Run the below command to deploy.
kubectl apply -f pod-deployment.yaml
- Lets expose these pods via a service.
apiVersion: v1
kind: Service
metadata:
  labels:
    app: probe-demo
  name: probe-demo
spec:
  selector:
    run: probe-demo
  type: NodePort
  ports:
  - name: 8080-8080
    port: 8080
    protocol: TCP
    targetPort: 8080
nodePort: 30001- I save the above content as service.yaml. Run the below command
kubectl apply -f service.yaml
- Check the Kubernetes resources status.
- As per Kubernetes, containers started running. So they are in Ready status within 5 seconds.

- Now, Lets try to access the application within 60 seconds.
- If you are within the cluster, access like this (if not, use your machine ip:nodeport)
wget -qO- http://probe-demo:8080/health
![]()
- We get connection refused error as server itself would have not started during this time.
- After 60 seconds, same request shows below response which is expected

- Basically Kubernetes thinks that App is ready as soon as it enters the running status. But in our case, it takes more than 60 seconds. This is a problem during deployment. So we need some kind of health check and app should be considered as ready only when the health checks are passing. That is where readiness probe comes into picture.
Readiness Probe:
I am including the readiness probe in the container section of the pod-deployment yaml as shown below.
apiVersion: apps/v1
kind: Deployment
metadata:
  labels:
    run: probe-demo
  name: probe-demo
spec:
  replicas: 2
  selector:
    matchLabels:
      run: probe-demo
  template:
    metadata:
      labels:
        run: probe-demo
    spec:
      containers:
      - image: vinsdocker/probe-demo
        name: probe-demo
        env:
        - name: START_DELAY
          value: "60"
        ports:
        - containerPort: 8080
        readinessProbe:
          httpGet:
            path: /health
            port: 8080
          initialDelaySeconds: 60
          periodSeconds: 5
          successThreshold: 1
          failureThreshold: 3
timeoutSeconds: 1- Delete the exiting deployment
kubectl delete -f pod-deployment.yaml
- Re create the deployment
kubectl apply -f pod-deployment.yaml
- If you see even exactly after 60 seconds, the pods are NOT in ready status. This is because readinessProbe’s initial delay and it waits for the readiness probe health check to pass.

- The pods become available after few seconds after the initial delay as it passes the health check.
- Now lets issue this command. We have 2 pods. one of the pods will receive this request and its request processing time becomes 30 seconds (below time in milli seconds)
wget -qO- http://probe-demo:8080/processing-time/30000
- If you issue couple of requests, you can see one request takes 30 seconds to respond
wget -qO- http://probe-demo:8080/health
- If you check the Kubernetes status, we can see that one of the pods become unavailable.

- This is because readinessProbe continues to monitor the health of the pods even after it becomes available after the first 60 seconds. If it does not respond as we had configured, it removes the pod from the service. So that the below request does not go to the pod which is not responding.
wget -qO- http://probe-demo:8080/health
Note: The readiness probe is used to remove the pod from the service. But it does not kill the pod. Pod is continued to be in running status even though it is not responding as we expected.
But we might want to take some action for the pods which are causing issues like this. In this case, I might want to restart pod.
Liveness Probe:
Lets see what happens If I configure the Liveness probe instead of Readiness probe as shown here.
apiVersion: apps/v1
kind: Deployment
metadata:
  labels:
    run: probe-demo
  name: probe-demo
spec:
  replicas: 2
  selector:
    matchLabels:
      run: probe-demo
  template:
    metadata:
      labels:
        run: probe-demo
    spec:
      containers:
      - image: vinsdocker/probe-demo
        name: probe-demo
        env:
        - name: START_DELAY
          value: "60"
        ports:
        - containerPort: 8080
        livenessProbe:
          httpGet:
            path: /health
            port: 8080
          initialDelaySeconds: 60
          periodSeconds: 5
          successThreshold: 1
          failureThreshold: 3
timeoutSeconds: 1- Delete deployment and recreate one. If you check the Kubernetes objects status, within 11 seconds, the pods are shown as Available. But actually they are NOT ready to accept any traffic as we know this already due to the initial delay we had set!

Note: Liveness probe can NOT be used to make a pod unavailable in case of issues.
- Lets send a request to simulate slow processing time.
wget -qO- http://probe-demo:8080/processing-time/30000
- We know that one of the pods which receives the request will not respond for 30 seconds. So livenessProbe checks will start failing.
- Whenever the liveness probe check fails, the pods are restarted. If you see the restart count has increased to 1 from 0 for one of the pods.

- However it does not change the Available count. That is, if the pod restarts the initial start delay we had set in the container will once again make the pod be actually unavailable for 60 seconds.
Note: Both readiness probe and liveness probe seem to have same behavior. They do same type of checks. But the action they take in case of failures is different. Readiness Probe shuts the traffic from service down. so that service can always the send the request to healthy pod whereas the liveness probe restarts the pod in case of failure. It does not do anything for the service. Service continues to send the request to the pods as usual if it is in ‘available’ status.
Summary:
After seeing Readiness probe and Liveness probe behaviors, It is recommended to use both probes in the deployment yaml as shown below. The reason being, in case of any pod failure or during deployment, with the help of the probes, we would be sending all the requests only to a healthy pods and pods would be restarted immediately in case of failure.
apiVersion: apps/v1
kind: Deployment
metadata:
  labels:
    run: probe-demo
  name: probe-demo
spec:
  replicas: 2
  selector:
    matchLabels:
      run: probe-demo
  template:
    metadata:
      labels:
        run: probe-demo
    spec:
      containers:
      - image: vinsdocker/probe-demo
        name: probe-demo
        env:
        - name: START_DELAY
          value: "60"
        ports:
        - containerPort: 8080
        livenessProbe:
          httpGet:
            path: /health
            port: 8080
          initialDelaySeconds: 60
          periodSeconds: 5
          successThreshold: 1
          failureThreshold: 3
          timeoutSeconds: 1
        readinessProbe:
          httpGet:
            path: /health
            port: 8080
          initialDelaySeconds: 60
          periodSeconds: 5
          successThreshold: 1
          failureThreshold: 3
          timeoutSeconds: 1


Hi Thanks for elaborative answer.
In the last exmample given in conclusion section. As healthy pod goes unhealthy which will take action liveness probe or readiness probe